PRODUCT / TRENDS
Explore and understand your metrics with Trends
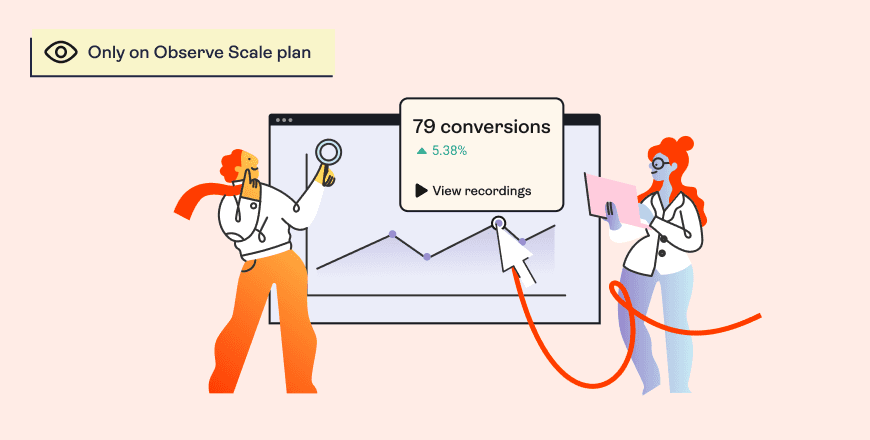
Traditional analytics only show you the numbers. Trends lets you see the full picture. Visualize your metrics to spot user behavior patterns and uncover the “why” behind the numbers by going to the relevant recordings and heatmaps directly from your charts.
PRODUCT / TRENDS
Explore and understand your metrics with Trends
Traditional analytics only show you the numbers. Trends lets you see the full picture. Visualize your metrics to spot user behavior patterns and uncover the “why” behind the numbers by going to the relevant recordings and heatmaps directly from your charts.
Trusted by 1,306,23 websites in 180+ countries


How it works
Trends connects the dots between user behavior and numbers in a single tool.
Create your custom conversion metrics and KPIs and visualize them as charts to spot trends over time.
“What we love about Trends is watching the recordings behind the numbers to explore why a metric is up or down.”

“Trends helps us connect our metrics with user behavior by analyzing recordings and heatmaps.”

“We use Trends to track conversions and then watch the recordings when they’re down. It helps understand what’s wrong.”

Unlock Hotjar Trends today
Bridge the gap between numbers and user insights. Trends is available on Observe Scale plan.

Track your custom metrics

Find deeper insights with a single click

GDPR- & CCPA-ready

Four tools available on every Hotjar plan
Use Trends to find the most relevant user insights in Hotjar’s tools

Heatmaps
Visualize user behavior

Recordings
See what your users see

Feedback
Discover how users feel

Surveys
Hear from your users

Interviews
Connect with users 1:1
An Introduction to Trends for beginners
A complete course to learn how to create custom charts in Trends to reduce user drop-off, understand why users get confused, and discover new opportunities for different segments.